Education
How To Identify And Trade The Butterfly Harmonic Pattern
Applying patterns to your advantage while trading is the key to success. Technical traders conduct market analysis using trading patterns and signals to generate smaller but more frequent profits from both rising and declining markets.
Although some technical indicators’ accuracy is questionable, most patterns have demonstrated their dependability for traders to assess market behavior and help them pinpoint entry and exit locations.
In contrast to other trading strategies, this pattern aims to forecast future price alterations.
We’ll discuss the Butterfly harmonic pattern in detail and what this pattern is. We’ll go through the characteristics of the pattern, how to spot it, and—more —how to trade it.
Table of Contents
Key takeaways:
. A harmonic reversal pattern is the butterfly pattern.
. It adheres to precise Fibonacci ratios.
What Is A Butterfly Pattern?
A harmonic chart reversal pattern is the butterfly pattern. It displays price consolidation and is behold after a lengthy price move. This pattern can be exercised by traders to identify when a trending advance is coming to an end and position themselves for the beginning of a correction or new trend phase.
A Harmonic butterfly took as a reversal pattern as it suggests a change in market sentiment from bullish to bearish or the other way around. The pattern is set up when four price swings, line in a specific mathematical relationship, creating a butterfly shape.
The pattern assists traders to make decisions about the placement of the trade and its price targets. From this point on, we’ll carry out a thorough study of How To Recognize And Trade The Butterfly Harmonic Pattern in particular.
How Is The Butterfly Pattern Recognized?
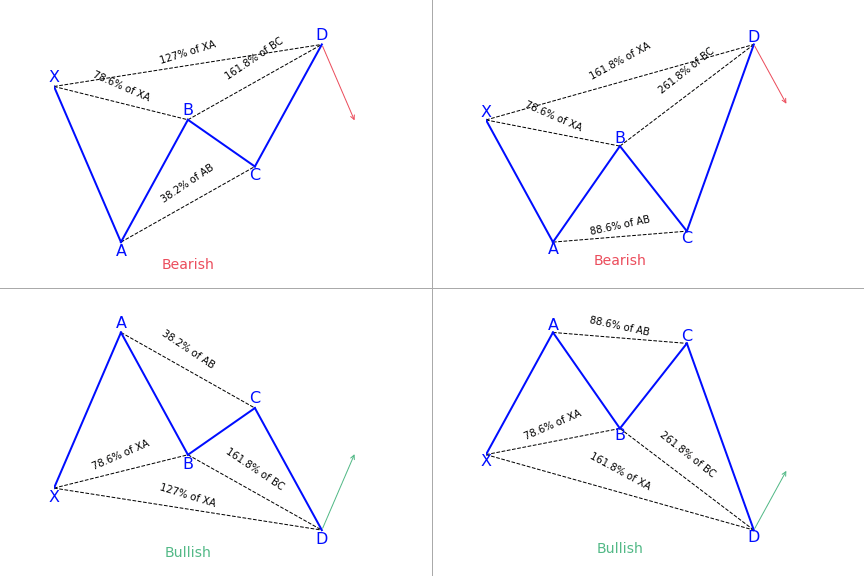
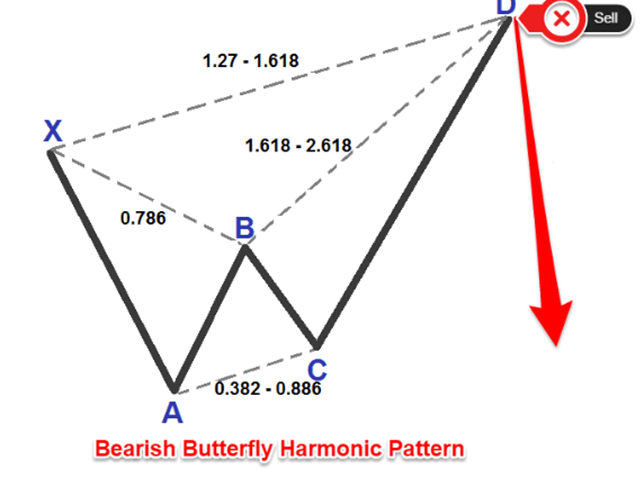
The butterfly design has four distinct legs with the labels X-A, A-B, B-C, and C-D. When the pattern has finished, the pattern instructs traders when to sell.
X-A
In its bearish form, the price falls from point X to point A, forming the first leg.
A-B
The A-B leg then recognizes the price direction shift and reverses 78.6% of the X-A axis’s motion.
B-C
The price again changes direction and swings lower in the B-C leg, retracing 38.2 to 88.6 percent of the A-B leg’s distance covered.
C-D
The C-D axis is this pattern’s last and most crucial element. The butterfly pattern also needs an AB=CD structure to be complete, like the Bat and Gartley designs, but the C-D leg stretches to produce a 127 or 161.8 percent extension of the A-B leg. Point D is where traders would like to enter the pattern.
With the pattern, traders attempt to place their trade entry order at the moment
The Butterfly Pattern: What Does It Tell Traders?
The Butterfly is one of the most significant harmonic patterns. The pattern reveals the crucial highs and lows of a trend underlined by both Carney and Pesavento. Different butterfly designs appear towards the end of a trend in different periods when utilizing alternative time frame analysis.
There are two variations of this pattern: a bullish one, in which case traders should buy, and a bearish one, in which case traders should sell. Applying the butterfly design requires precision because trading errors can be outcast.
Before engaging in any trading activity, it is necessary for traders to understand how to indentify and trade the butterfly pattern as well as some other important relevant extensive explanations and coverage.
Bullish vs Bearish

Key Differences
The primary distinction between each pattern is how it begins, except for the “upside-down” and “right-side-up” bullish and bearish variations of the butterflies.
The pattern will end as a bearish butterfly if XA begins as an uptrend.
If XA begins as a downtrend, the bullish butterfly pattern is developing.
What Happens If There’s a Breakout?
From the 127% potential reversal zone, the market might continue to move upward. When this happens, the market may pause, but it still stretches past the 127% zone.
So, it is helpful to use a breakout trade setup.
Remember that not every losing trade will prevent this bullish breakout setup. The market will surge and reach your bullish breakout signal at horizontal resistance before correcting downward.
It’s crucial to set a stop loss on every trade because of this. When this happens, your stop loss will go into effect, allowing you to exit the trade before suffering a larger loss. An account balance-destroying large losing trade is preferable to a tiny losing trade. If you are willing to look Cryptocurrency Prices you should visit Coin Market Cap.
Reliability of the Harmonic Butterfly Pattern
There are several similarities and distinctions between various chart reading patterns and the harmonic butterfly pattern. A pattern’s dependability depends on the analyst’s ability to interpret it.
Pros:
The pattern’s geometrical character, which Scott Carney has studied, might give traders more confidence when they recognize the formation on a chart. To increase the accuracy of its identification, the pattern also has a precise set of ratios. The more these ratios and structures are present, the more likely it is that a pattern will appear.
Constraints:
In trading, no strategy is completely accurate. Sometimes a pattern will have all the appropriate ratios and the perfect appearance, yet it will still fall short.
This makes it decisive to set a stop loss on each trade. You may choose the proper location for the stop loss using the above guidance without taking on too much or too little risk.
Conclusion
In the realm of trading, harmonic patterns are growing in popularity. Structures like the Gartley and bat are examples of internal patterns and structures like the butterfly and crab are the building blocks of external patterns that exist.
Butterfly patterns are still the most common among all. You should never undervalue the effectiveness of chart patterns as trading analysis tools, regardless of whether you are an experienced trader or a learner. They are essential for identifying entry and departure points as well as signaling a change in direction or continuance of the present trend. Particularly butterfly patterns can be useful in predicting when price swings will finish. They have a high degree of predictive accuracy when applied.
FAQ’s
What harmonic trading patterns are most effective?
The Gartley, bat, and crab harmonic patterns are among the most popular ones.
What does Butterfly’s profit goal entail?
A lengthy butterfly will make between 25% and 50% of the potential profit.
How can I begin a butterfly trade?
The most straightforward butterfly spread involves buying one call option at a particular strike price, selling two call options at a higher strike price, and buying another call option at a higher strike price.
Read more – Essential Tips for Writing an Effective Research Paper

Why Text-to-SQL Models Break in Production (And How Semantic Layers Solve the Problem)

The Role of Peptides in Dry Skin Sunscreen: Unlocking Hydration and Protection

No Dogs Left Behind Complaints: Honest Answers to Common Concerns


-

 Business5 years ago
How to Do Long-Distance Moves with Children
-
 Business3 years ago
The Ultimate Guide To Thriving In Your Printing Franchise
-
Business3 years ago
Exploring The Benefits And Challenges Of Restaurant Franchising
-

 Tech5 years ago
Cyber Table That Will Change Your Life
-
Lifestyle3 years ago
Dallas’ Hidden Gems: 6 Must-Try Restaurants Off The Beaten Path!
-

 Biography3 years ago
Melody Marks- Personal Life, Education, Career, And Much More
-

 Business5 years ago
Is Guest Posting a Good Inbound Marketing Strategy?
-
Lifestyle3 years ago
Top 10 Restaurant Franchises In The US


Recent Comments